Migration balances for 2007 in selected EU member states (bpb) Lizenz: cc by-nc-nd/2.0/de
- Als JPG herunterladen (68.9kB)
Migration balances for 2007 in selected EU member states (bpb) Lizenz: cc by-nc-nd/2.0/de
- Als JPG herunterladen (68.9kB)
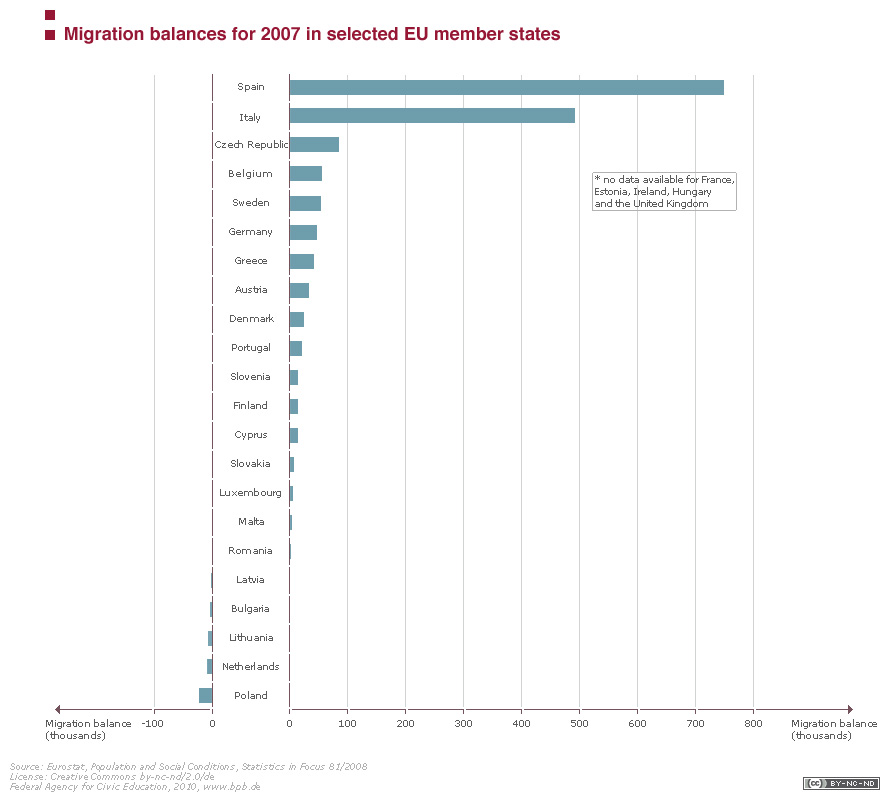
European Statistical Office (Eurostat) data for 2007 indicate the continuation of highly differing forms of immigration, with a clear shift in the relationship between "old" and "new" immigration countries. Thus countries on the southern border of the EU (Spain and Italy) are experiencing the highest level of immigration, and even the Czech Republic, a new member, has already overtaken the traditional receiving countries of central and northern Europe. Only the Baltic States, Bulgaria and Poland now show negative immigration balances, although even the Netherlands recorded more emigration than immigration in 2007 (see figure).
The percentage of foreign population in the EU member states extends from less than 1% of the total population (Slovakia) through to 39% (Luxemburg). In most countries, however, the foreign percentage is between 2% and 8% of the total population (see Table). In all EU member states excluding Luxemburg, Belgium, Ireland and Cyprus, the majority of the foreign population is made up of so-called third country nationals, i.e. non-EU citizens.
Native and foreign populations in the member states of the European Union, 2004 and 1990
| Year | Foreigners (%) | Largest foreigner groups (by country of citizenship) | Year | Foreigners (%) | |
|---|---|---|---|---|---|
| Belgium | 2004 | 8,3 | Italy | 1990 | 8,9 |
| Czech Republic | 2004 | 1,9 | Ukraine | 1990 | 0,3 |
| Denmark | 2004 | 5,0 | Turkey | 1990 | 2,9 |
| Germany | 2004 | 8,9 | Turkey | 1990 | 6,1 |
| Estonia | 2000c | 20,0 | Russian Federation | 1990 | - |
| Greece | 2004e | 8,1 | Albania | 1990 | 1,4 |
| Spain | 2004 | 6,6 | Ecuador | 1990 | 1,0 |
| France | 2004 | 5,6 | Portugal | 1990 | 6,3 |
| Ireland | 2002c | 7,1 | United Kingdom | 1990 | 2,3 |
| Italy | 2004 | 3,4 | Albania | 1990 | 0,6 |
| Cyprus | 2002c | 9,4 | Greece | 1992 | 4,2 |
| Latvia | 2004 | 22,2 | Russian Federation | 1998 | 27,3 |
| Lithuania | 2001c | 1,0 | Russian Federation | 1990 | - |
| Luxembourg | 2004 | 38,6 | Portugal | 1990 | 28,7 |
| Hungary | 2004 | 1,3 | Romania | 1995 | 1,3 |
| Malta | 2004 | 2,8 | United Kingdom | 1990 | 1,6 |
| Netherlands | 2004 | 4,3 | Turkey | 1990 | 4,3 |
| Austria | 2004 | 9,4 | Serbia and Montenegro | 1990 | 5,7 |
| Poland | 2002c | 1,8 | Germany | 1990 | - |
| Portugal | 2003p | 2,3 | Cape Verde | 1990 | 1,0 |
| Slovenia | 2004 | 2,3 | Bosnia-Herzegovina | 1990 | - |
| Slovakia | 2004 | 0,6 | Czech Republic | 1990 | - |
| Finland | 2004 | 2,0 | Russian Federation | 1990 | 0,4 |
| Sweden | 2004 | 5,3 | Finland | 1990 | 5,3 |
| United Kingdom | 2003 | 4,7 | Ireland | 1990 | 4,2 |
Source: eurostat 2006
It is not only in terms of numbers that the immigration situation differs in the various EU states. There are also strong differences with regard to the legal categories on which the immigration flows are based. Thus labour migration dominates in countries with less regulated labour markets (e.g. the United Kingdom, Ireland, the Czech Republic and Denmark), whereas in most other states family reunification represents the strongest immigration category (especially apparent in France and Sweden). In this regard, Italy and Germany adopt a middle position, i.e. similar percentages are attributable to labour migration and family reunification, although in Germany "other" migration also makes up a large percentage. The latter is attributable above all to the immigration of Spätaussiedler (ethnic German immigrants from the countries of the former Soviet Union).
The geographical origin of the biggest immigrant groups also varies conspicuously from one member state to another and reflects primarily historical experiences and geographical proximity. Thus, for example, in Germany, Denmark and the Netherlands, Turkish citizens make up the biggest group of foreigners. By contrast, citizens of former colonies are numerous in Portugal (Cape Verde, Brazil and Angola) and in Spain (Ecuador and
Finally, immigrants' levels of qualification play an increasing role in political debate. At the present time, all Western states have become anxious to increase the number of people with a good education or university degree among their immigrants. Nonetheless, in most of the member states immigration is dominated by the low skilled. Only the United Kingdom records almost equal percentages of highly and low-skilled migrants. In Italy, Austria and Germany, by contrast, immigration is dominated now as ever by the lower skilled.